We encourage you to use our data and look at the territory with a new approach. In the Data Hub we present data analysis carried out by the municipality, but also by the community. APPs, dasboards and new software, or files modeled from the sources, are some of the resulting products. Discover the most interesting data reuses from the community and interact with their producers.
How to be a Contributor? Discover our open data and link it to other sources. Produce analyses and graphical representations, and share your knowledge with the community.
Learn how to reuse the available data. If you want to become agile in navigating the portal, as well as in automating captures or reading produced content, look for the resources available in our Digital Academy.
Are you interested in one of the re-uses and want to contact the producer? Get in touch with us.
Air Quality Sensing Network | ENVIRONMENT & ENERGY
On this dynamic map, it can be seen the daily averages of air pollutants (CO, O3, NO2, PM 10, PM 2.5), as well as some meteorological data, allowing to frame the municipality's air quality. By clicking on each of the sensors, its location can be discovered, as well as its daily measurement averages. #visualization
Owner: QART
Data Featured: Air Quality Map - daily values | Parede sensor , Abóboda sensor, Rebelva sensor, Manique sensor, Malveira sensor, Alcabideche sensor, Cascais (center) sensor | Estoril sensor | Guincho sensor
Covid19 Analytics | MOBILITY
This study addresses the population's compliance with the mobility containment measures taken by the government in early 2021. Through the combination of mobility indicators (by travel typology), NOS mobility data and land use classification analysis, it was possible to determine that the second confinement had less impact on restricting the mobility of citizens in Cascais, with the typical mobility behavior being reduced only between 15 to 25% in the county space. #academic_research
Owner: NOVA SBE - Data Science Knowledge Center | NOS
Data Featured: Statistical Sections | Soil Qualification | NOS Internal Data | Data from other external sources (detailed in the study, section 2.1)
Predicting Air Quality for Outdoor Activities | ENVIRONMENT & ENERGY
Mathematical model for predicting the best places to enjoy the outdoors, according to typology, through the evaluation of the county air quality. #Mathematical model
Owner: BelManuel Soto (Participant team in the World Data League, 2021 edition)
Data Featured: Air Quality Map - daily values | | Parede sensor , Abóboda sensor, Rebelva sensor, Manique sensor, Malveira sensor, Alcabideche sensor, Cascais (center) sensor | Estoril sensor | Guincho sensor | Playgrounds | Municipal Parks | Nature Sports Circuit | Outdoor gyms | Beaches
Predicting Air Quality for Outdoor Activities | AMBIENTE & ENERGIA
Modelo matemático de predição dos melhores locais para usufruto do ar livre, consoante tipologia, através da avaliação da qualidade do ar concelhia. #modelo matemático
Produtor: Sidereus (Equipa participante do World Data League, edição de 2021)
Dados Utilizados: Mapa de Qualidade do Ar - valores diários | sensor da Parede , sensor da Abóboda, sensor da Rebelva, sensor de Manique, sensor da Malveira, sensor de Alcabideche, sensor de Cascais (centro) | sensor do Estoril | sensor do Guincho | Parques Infantis | Parques Municipais | Desporto de Natureza | Circuitos de Manutenção | Praias
 Supply and demand of the local public transport network | MOBILITY
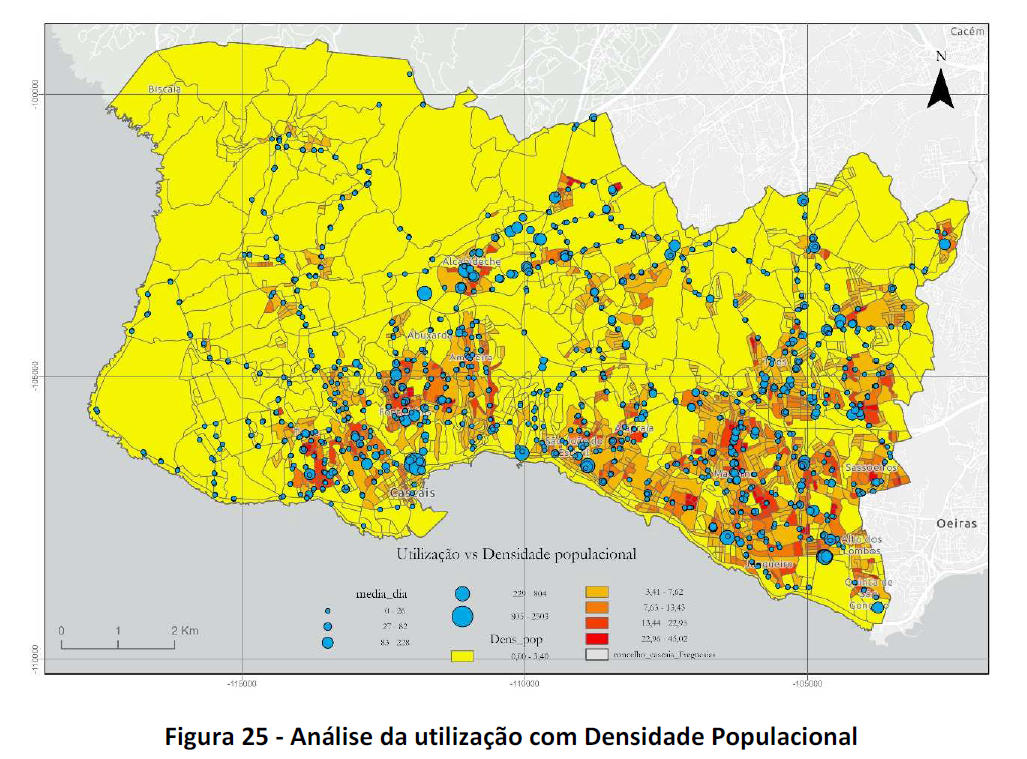
Geographical model that identifies the most demanding areas/needs for public transport, and the current coverage of the municipal road transport network. It outlines the improvements to be implemented in the municipality for the optimization of the system.
Owner: Mª. Rosário Rodrigues (Master's dissertation)
Data Featured: Commerce and Services | Industrial Establishments | Public School Facilities | Shopping Centers | Health Facilities | Local Government Services | Central Government